Haus Command Center
A live, auth-gated operations dashboard for a multi-property short-term-rental portfolio. Real PMS, pricing, and operations data pulled into one single-pane view, deployed on edge infrastructure and gated by zero-trust access.
Running a multi-property short-term-rental portfolio means the numbers that tell you whether you are healthy this morning are scattered across three systems. Revenue and bookings live in the property-management system. Occupancy and market comparison live in the pricing tool. Maintenance issues and the sales pipeline live in a database. Answering one simple question, are we okay today, meant logging into three tools and doing the arithmetic by hand.
Haus Command Center is the answer: a single, access-controlled page that consolidates all three into one operator view. It is real, it is live behind a private custom domain, and it is in daily use. It is shown here with permission, with every property name and financial figure masked for public display.
All figures, property names, and people in the screenshots below are masked for public display. The architecture, integrations, and deployment described are the real system, unaltered.
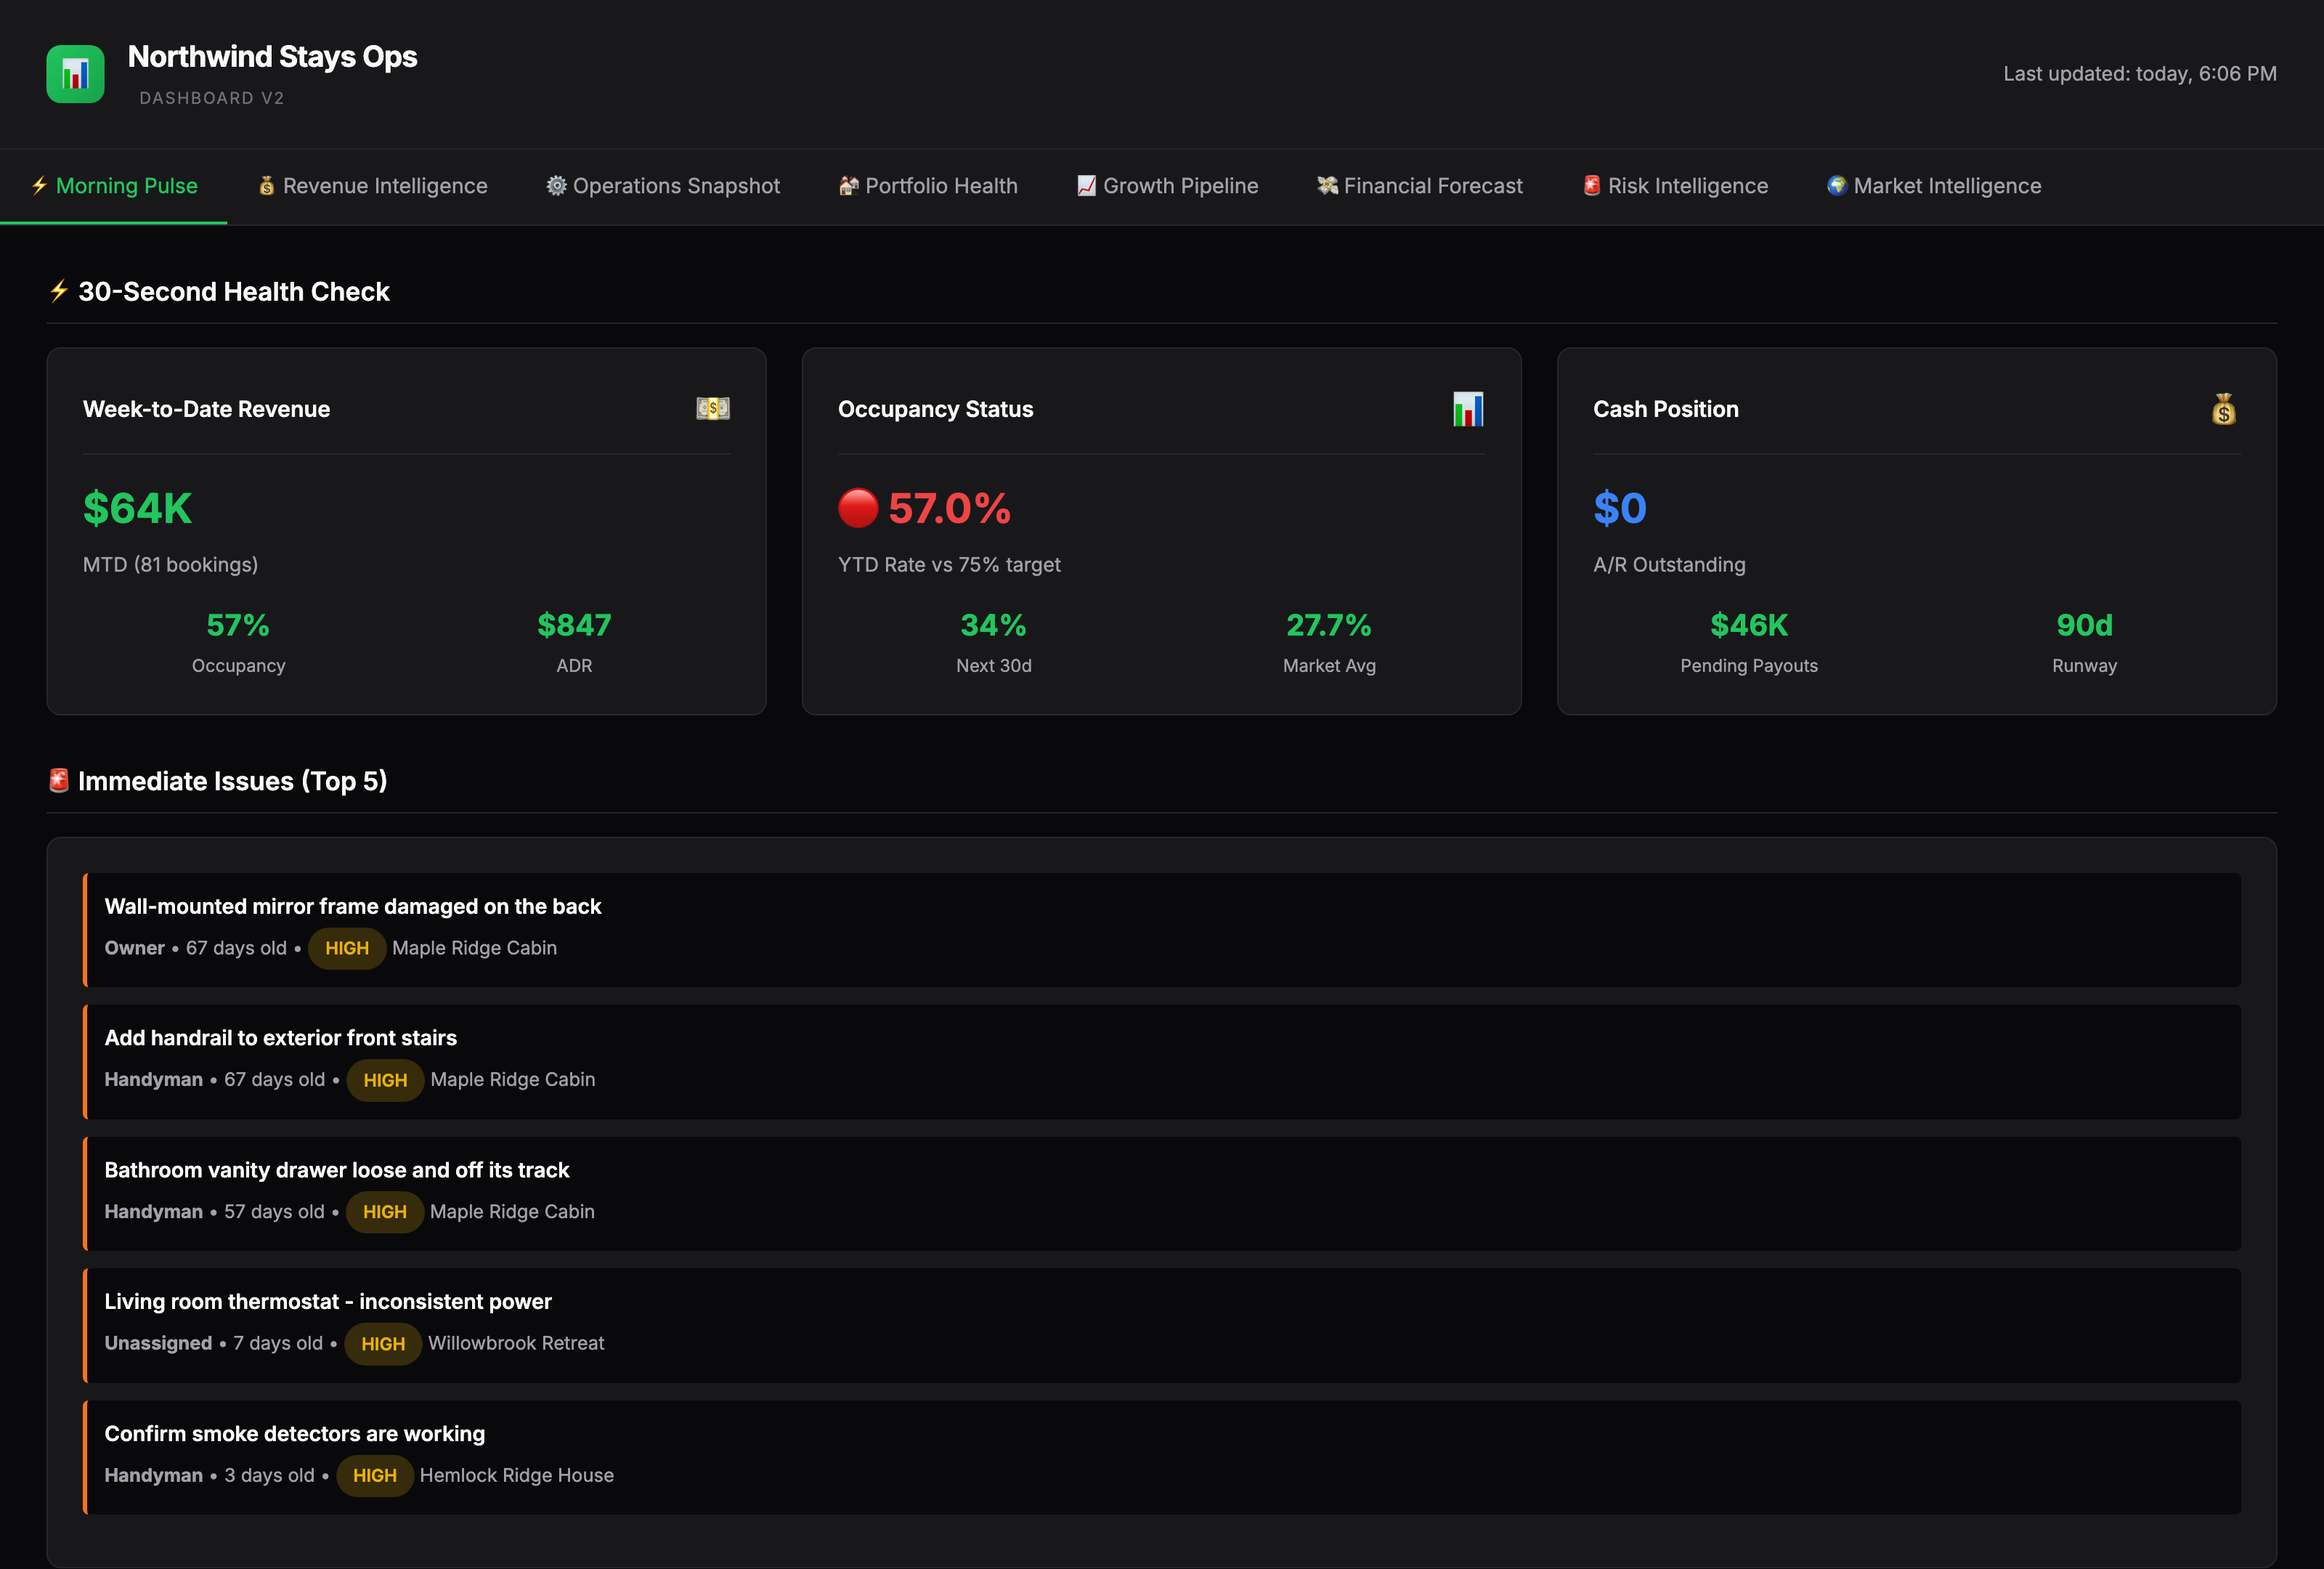
The 30-second glance came first
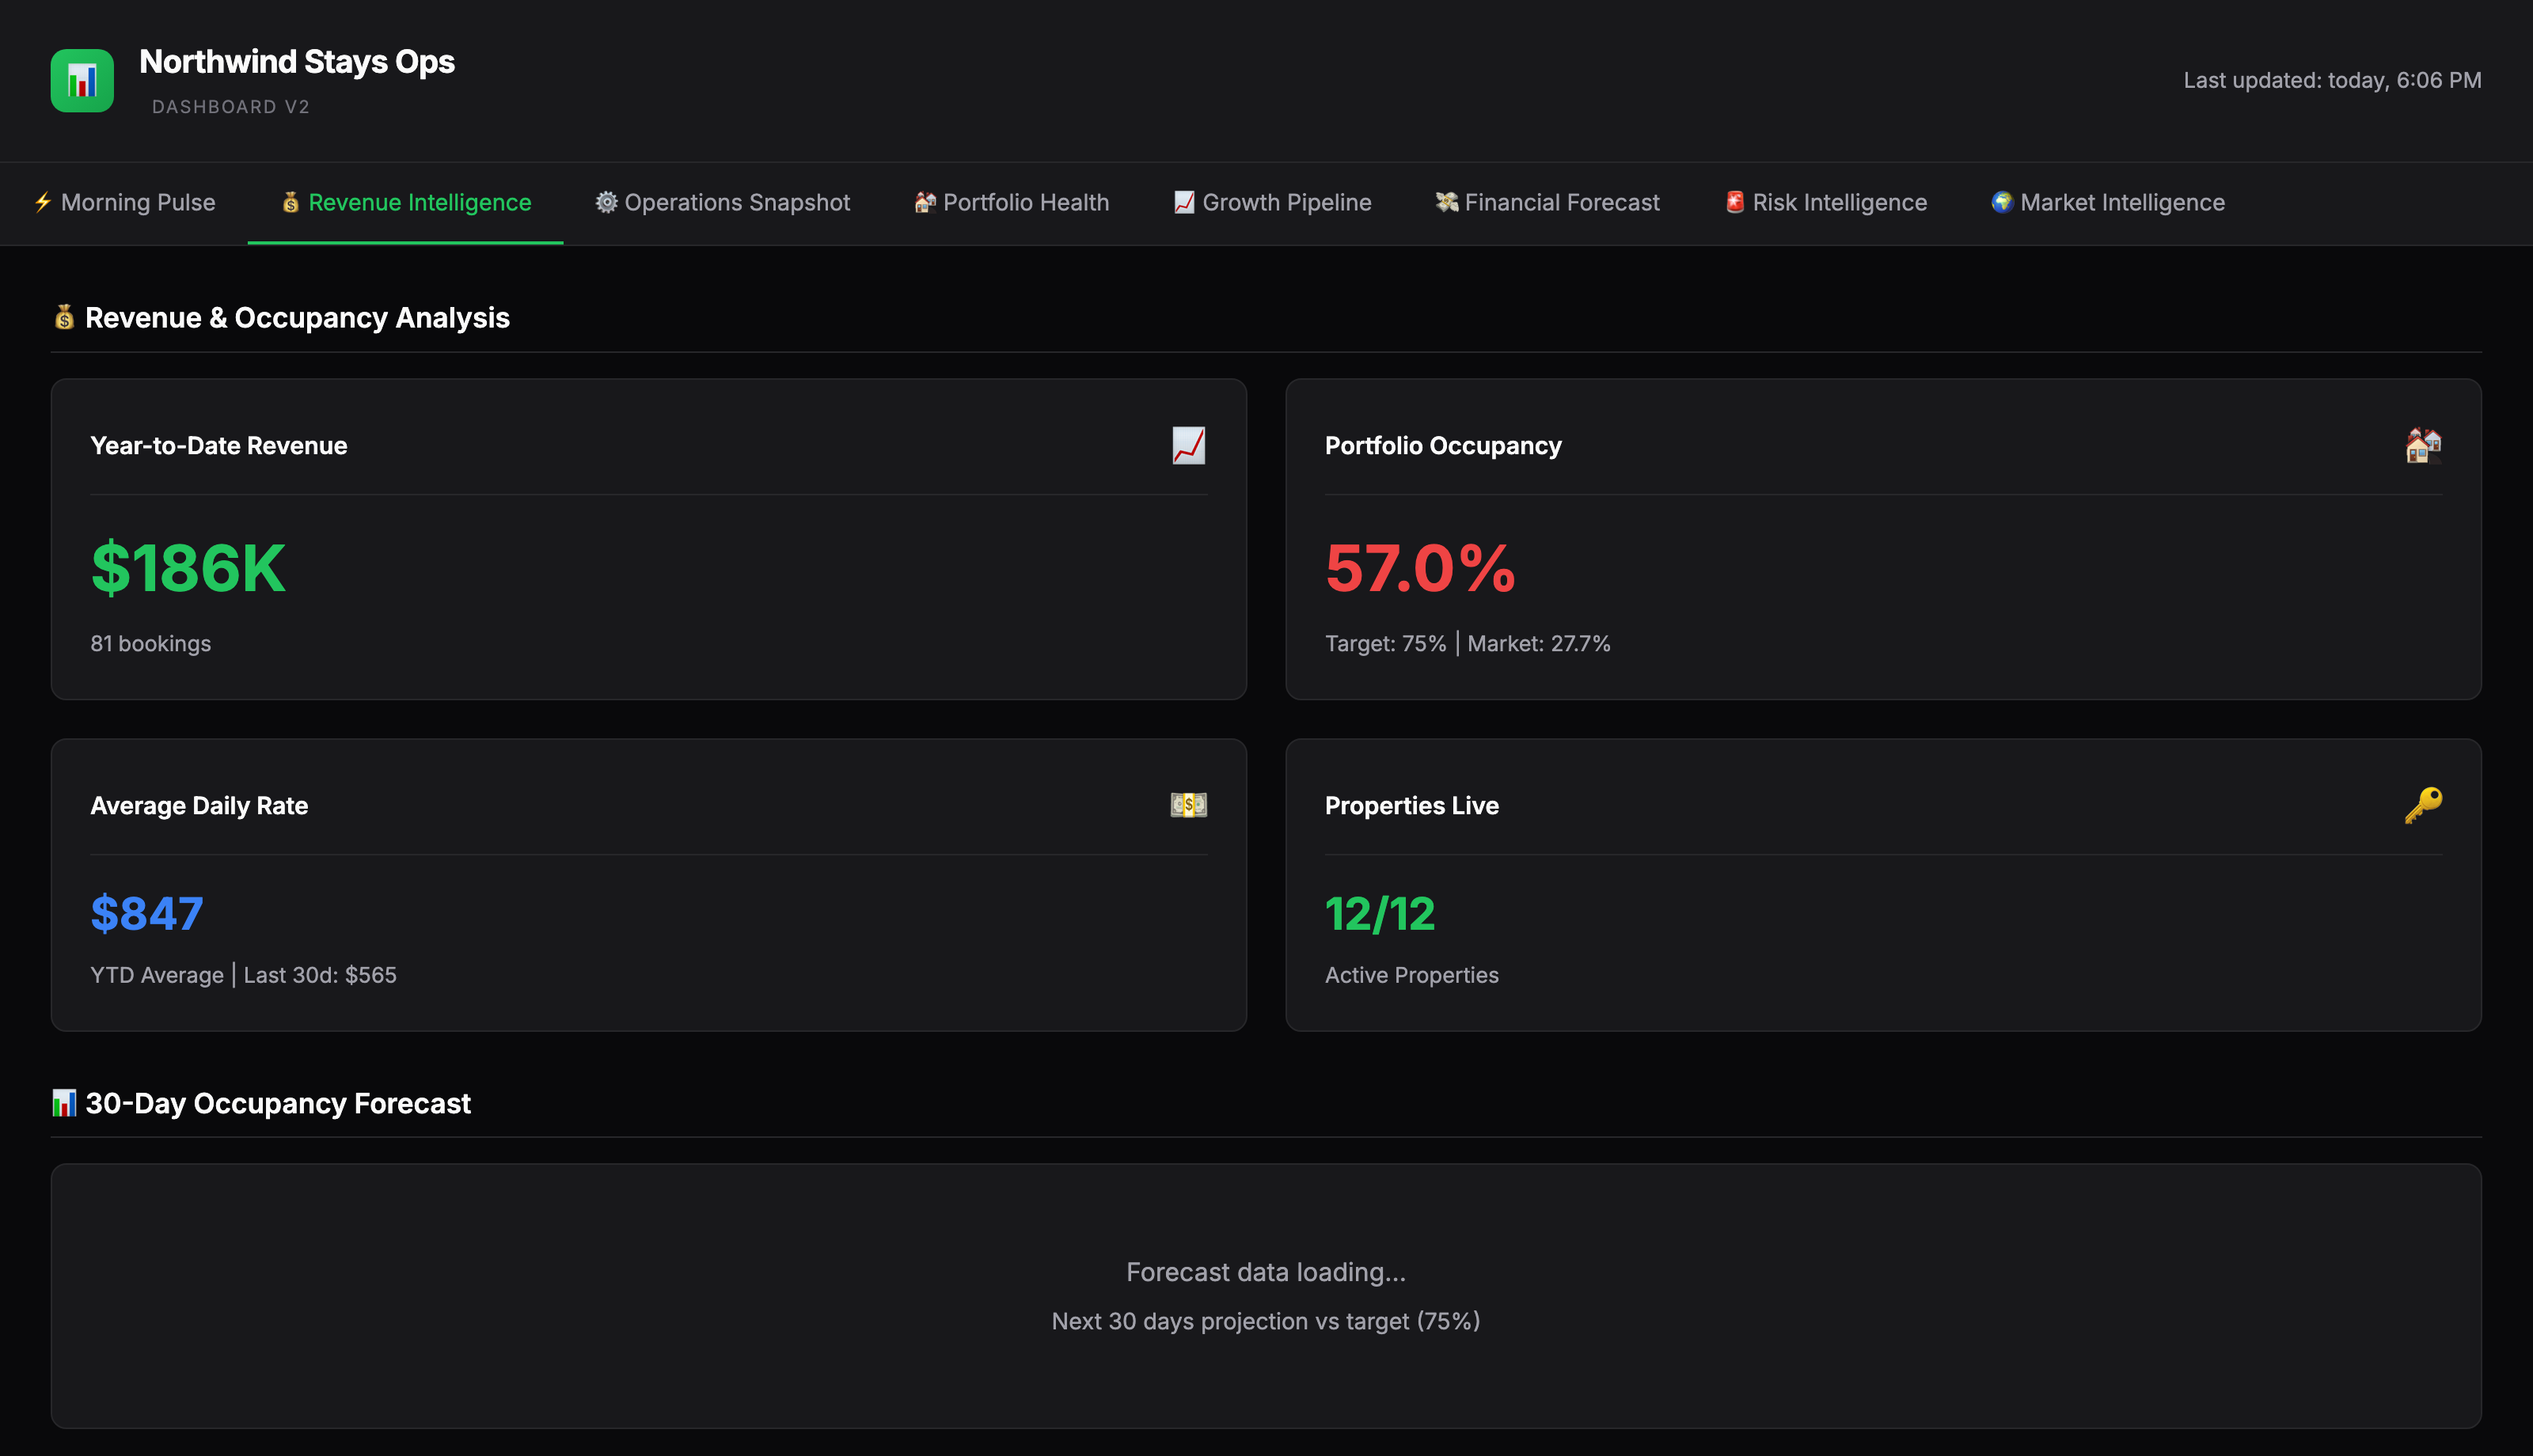
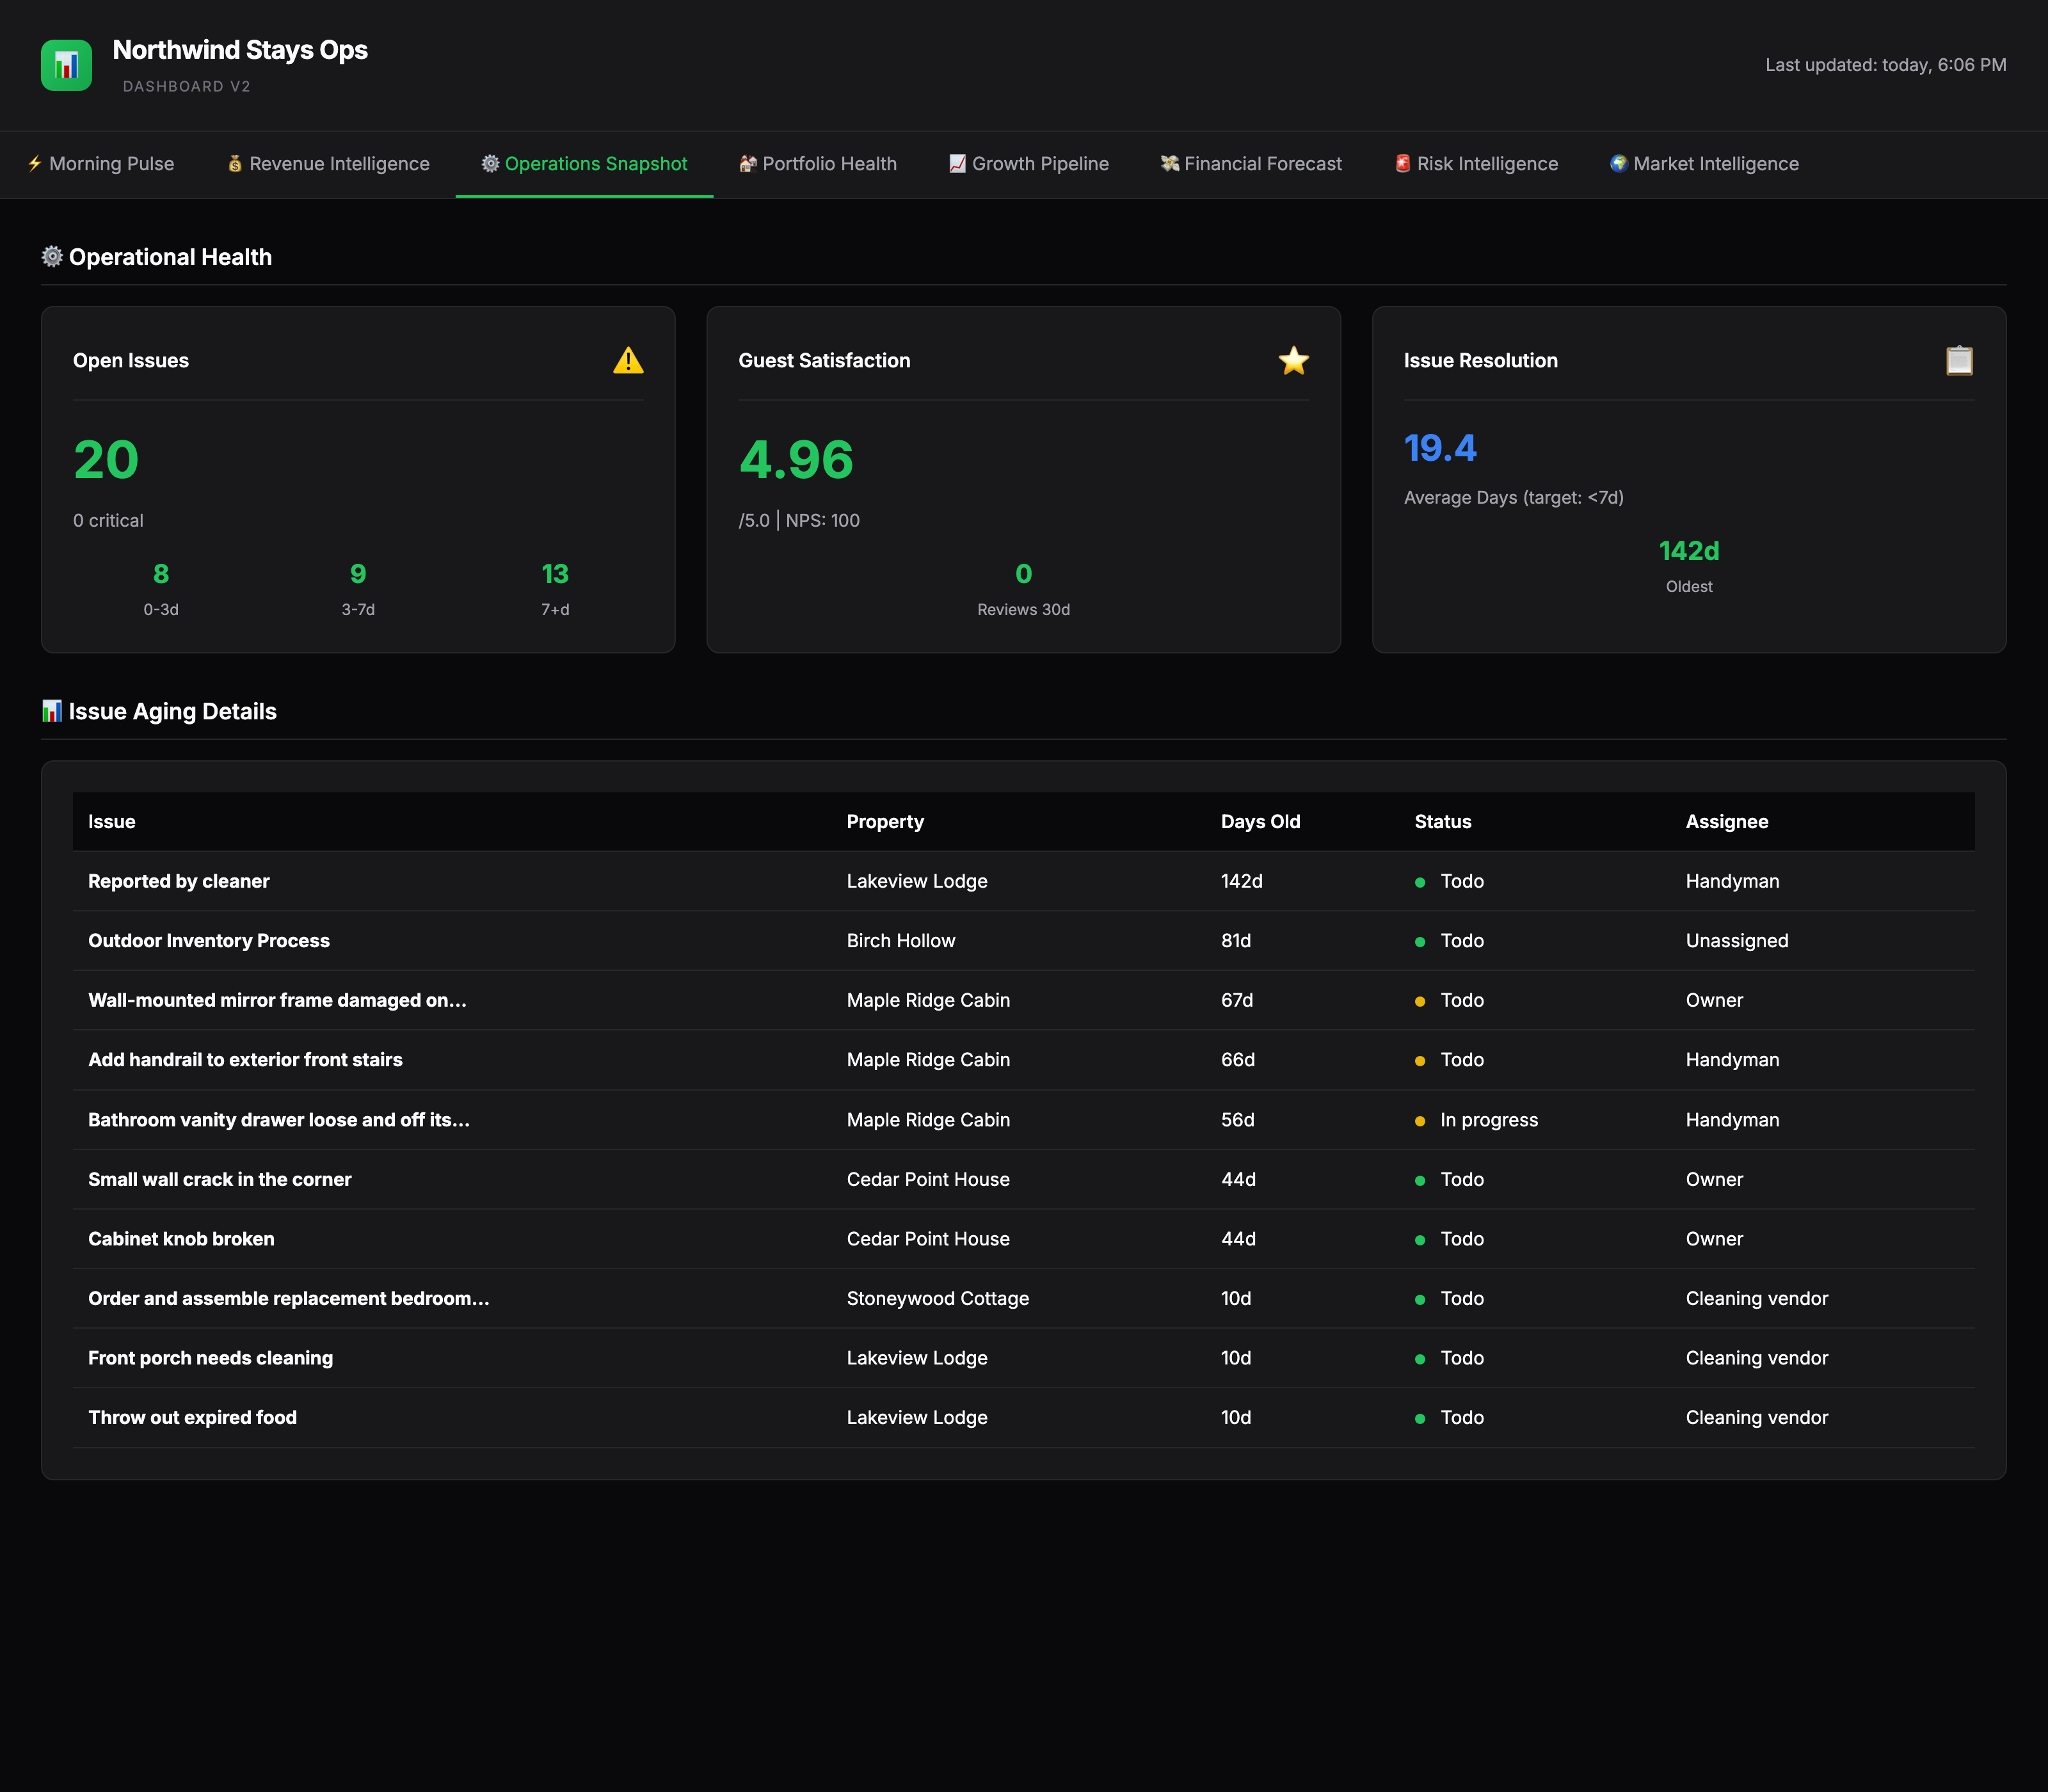
The information architecture is built around the question a busy owner asks first thing in the morning, not around what the data happened to make easy. The landing tab, Morning Pulse, answers revenue, occupancy against the market comp, and the top open issues immediately. Deeper tabs hold the revenue intelligence and operations detail you reach for when something on the front page needs a second look. The design borrows the dashboard idiom on purpose: large KPI numerals, a single green accent for healthy values, and amber and red for anything that needs attention.
The cheapest durable architecture that fits the job
The dashboard is a static site, not a server application. There is no framework, no build step, and nothing to keep running. The page is a single file of vanilla HTML, CSS, and JavaScript with the current numbers baked in, so it loads instantly and has almost no attack surface. A scheduled job pulls fresh data from the three sources, rewrites the artifact, and a Git-driven deploy publishes it to Cloudflare Pages. The deployed page also carries a timed meta-refresh so a tab left open picks up the latest published build on its own. The result is a tool that is fast, cheap, and effectively maintenance-free.
Auth lives at the edge, not in the app
Financials never sit on the open internet. The entire site is gated by Cloudflare Access with email-PIN verification, so reaching the dashboard requires a verified address on the access policy. Because authentication is handled at the edge rather than bolted into application code, there is no login form to build, no session store to run, and no auth code to get wrong. The static artifact behind the gate has no secrets in it, and the credentials that talk to the source APIs live only in the scheduled refresh job, never in the page.
Shipped in tiers, and honest about it
The dashboard is laid out as an eight-tab plan, with three tabs fully built and live today and five labeled Coming Soon. That is a deliberate choice, not an oversight. The three live tabs are useful right now, and the roadmap is visible to anyone who opens the tool. Showing a real product mid-build reads as more credible than pretending everything is finished.
- Morning Pulse
- Revenue Intelligence
- Operations Snapshot
- Portfolio Health
- Growth Pipeline
- Financial Forecast
- Risk Intelligence
- Market Intelligence
One surface of a larger system
The dashboard does not stand alone. It sits on top of the same Hostaway, PriceLabs, and Airtable data layer that powers a much larger operations toolkit for the portfolio: a deep set of skills and data engines that handle pricing, reviews, owner reporting, and maintenance triage. The Command Center is the human-readable front of that plumbing, which is why it can stay so simple. The hard work of reconciling the sources happens upstream; the dashboard just has to present it clearly.
The stack
This is real, in-use work for a portfolio owned by the practice, shown with permission. The live site is access-gated behind a private custom domain and is not linked here. Every property name, person, and financial figure in the screenshots is masked for public display; the architecture and integrations are described as they actually run. No traffic, time-saved, or revenue figure is claimed, because none was measured for this write-up.